Your Brain Craves Infographics
It Only Takes 150ms for a Symbol to Be Processed +100ms to Attach Meaning to It
Data visualization is the process of communicating stories that live in data and statistics, as seen in the numbers obtained from breastcancer.org. In this age of big data, meta-patterns, and single data points, it is easy to distill the complex into simple visual representations.
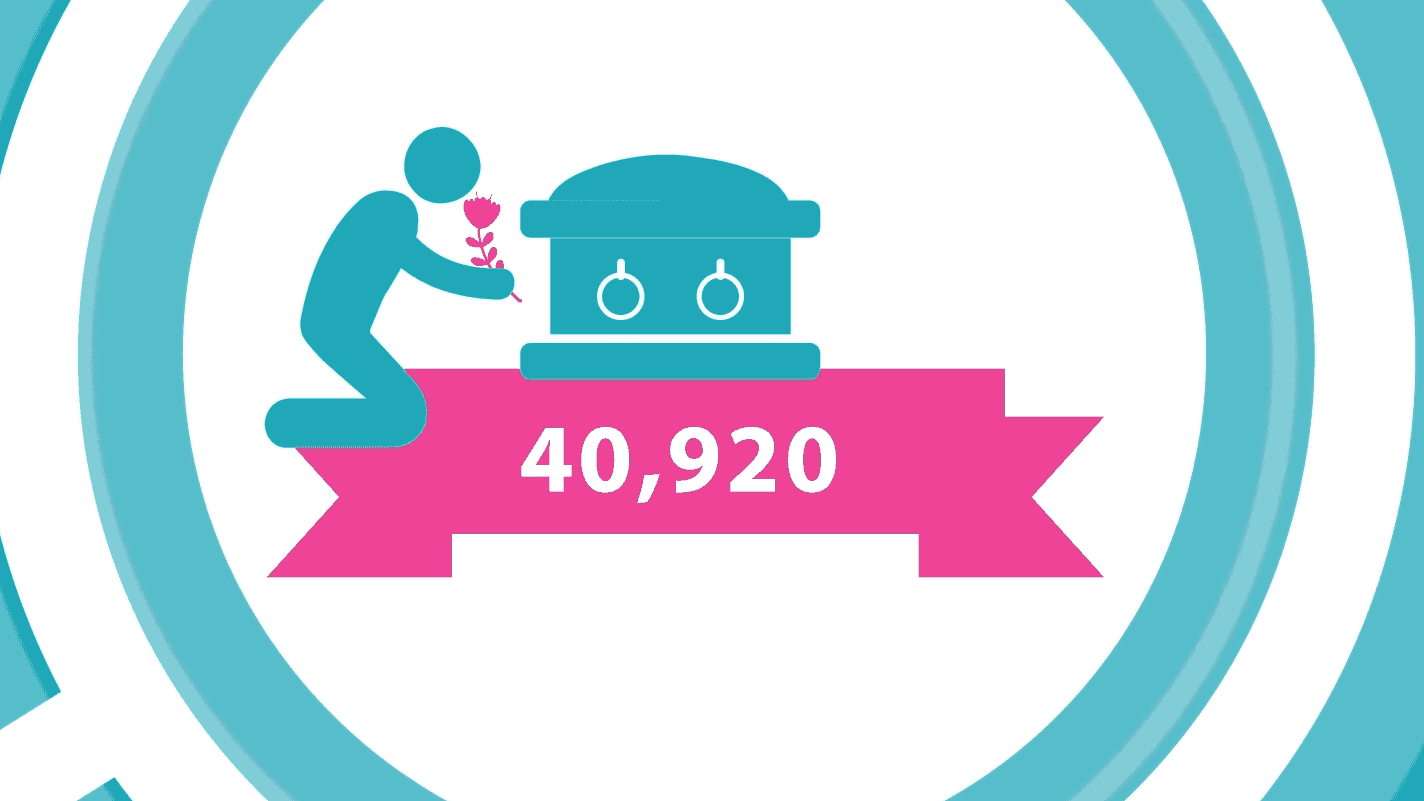
I thought it a good idea to show you how I developed this infographic based on Breast Cancer Stats. It shows a pattern that transports learners through a narrative arc starting from 2000 and ending in 2018. The infographic arc uses tiers of strata logically and concisely packed to form stacked levels of digestible graphics.
Pipeline for Developing an Infographic
The graphical display of abstract information into physical attributes of vision using elements of design like line, color, shapes,
and more, is what I enjoy about visualization. Here are a few steps to keep in mind as you build yours out.
Exact Copy:
The script must be 100% approved
by the client before any
work can begin.
Wireframe & Mood Board:
Wireframe: to show content flow.
Mood board: the brand look for the entire project
including images, fonts, and colors in context.
Vectorize & Edit:
Adobe Illustrator, one of the most
powerful tools for creating crisp icons.
Design, review, and edit to perfection.
How I Push creative boundaries with tools
Infographics, minimalistic, and flat graphics play vital roles in today’s eLearning. Don’t make everything an infographic. My rule is that the needs of the audience and the nature of the activity should determine the format you decide to use and not the other way around.
I have included a few links to help you develop infographics with rapidity.


Leave a Reply
Want to join the discussion?Feel free to contribute!